Performance
This page shows how fast Talesmith runs on one real machine, in real windows and headlessly, what each kind of content costs, and how to measure your own game with the performance overlay, profiler reports, headless benchmarks and live metrics. Every number here was measured, with the commands given, so you can reproduce them on your own hardware.
The test machine
All numbers on this page come from one laptop:
| Processor | AMD Ryzen 9 PRO 8945HS, 8 cores, 16 threads |
| Graphics | AMD Radeon 780M (integrated), Mesa RADV Vulkan driver |
| Display | 120 Hz |
| System | NixOS, KDE Plasma on Wayland; Talesmith windows run through XWayland |
| Runtime | .NET 10.0.12, Release builds |
An integrated GPU and a laptop processor are a modest target: a desktop with a discrete graphics card has more headroom for lights and particles. Other programs were running during the measurements, so expect a few percent of noise between runs.
What to expect in a game
In a window
These runs use the player with a 1600 × 900 window, VSync on (the default) and the performance overlay showing. The numbers are averages over about 16 seconds, collected with dotnet-counters from the running game (see Live metrics).
| Scene | Renderer | Frame rate | Frame interval, 99th percentile | Game work | Render work (CPU) | GPU |
|---|---|---|---|---|---|---|
| Lantern Grove | Vulkan | 120 fps | 9.2 ms | 0.27 ms | 1.47 ms | 1.1 ms |
| Lantern Grove | Skia (GPU) | 113 fps | 10.4 ms | 0.36 ms | 4.1 ms | |
| scale (10,000 sprites, 47,500 particles, 32 shadowed lights) | Vulkan | 120 fps | 15.3 ms | 3.5 ms | 0.42 ms | 2.0 ms |
| scale | Skia (GPU) | 114 fps | 11.9 ms | 4.8 ms | 1.9 ms | |
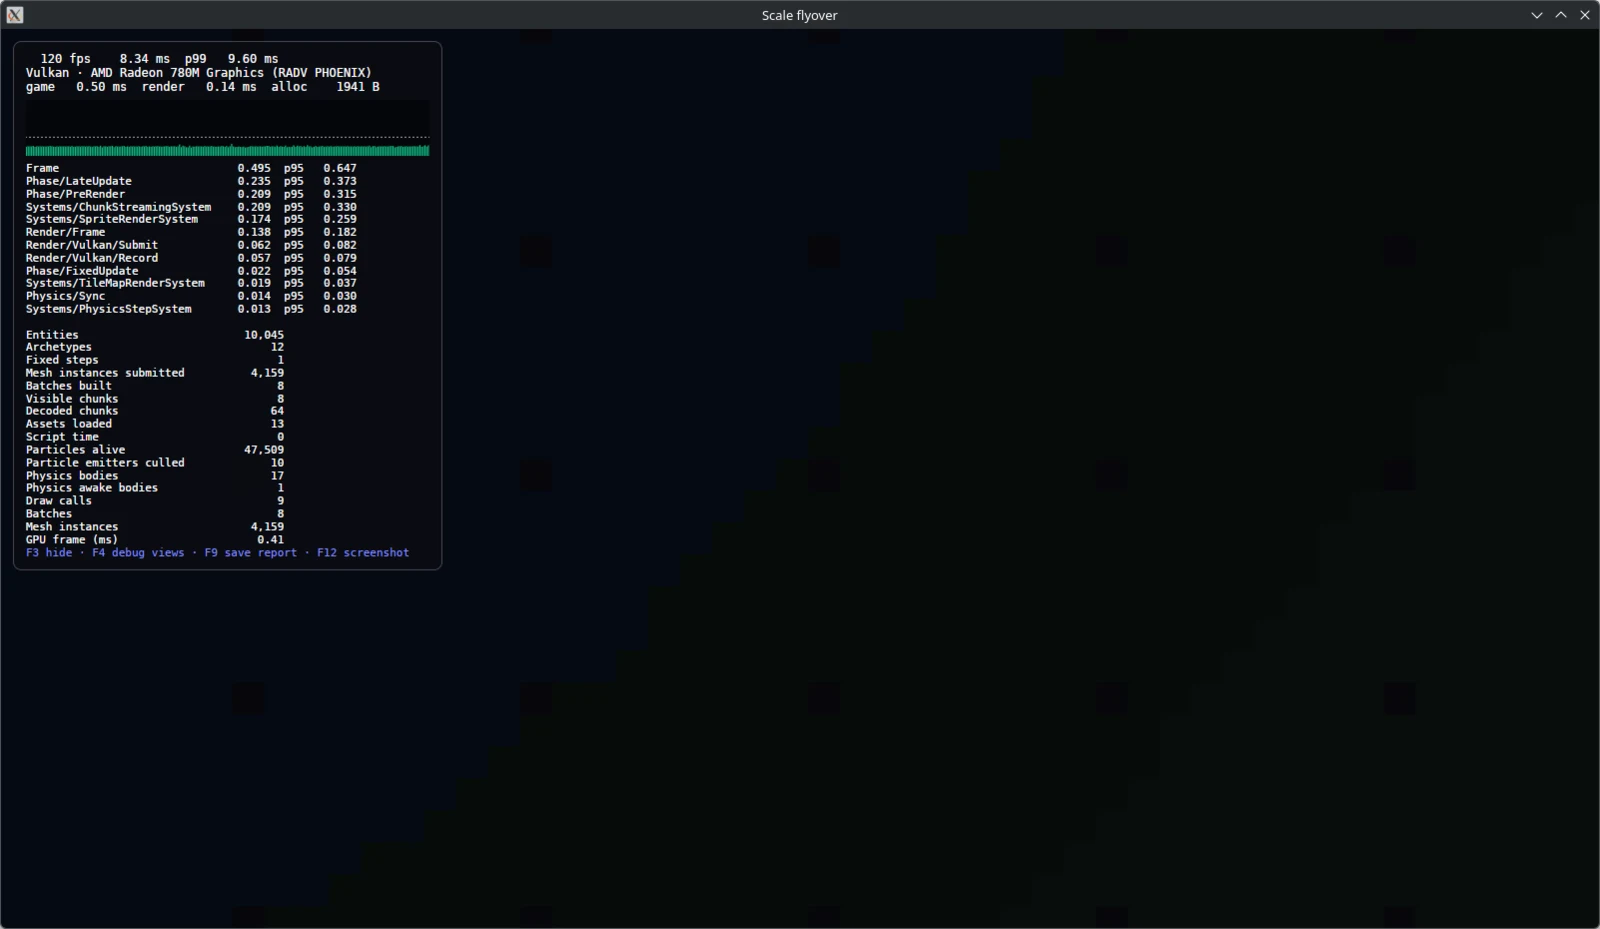
| scale-flyover (streaming a 2.1 million cell map) | Vulkan | 120 fps | 9.5 ms | 0.73 ms | 0.16 ms | 0.5 ms |
| scale, VSync off | Vulkan | 292 fps | 4.3 ms | 3.4 ms | 5.2 ms | 2.0 ms |
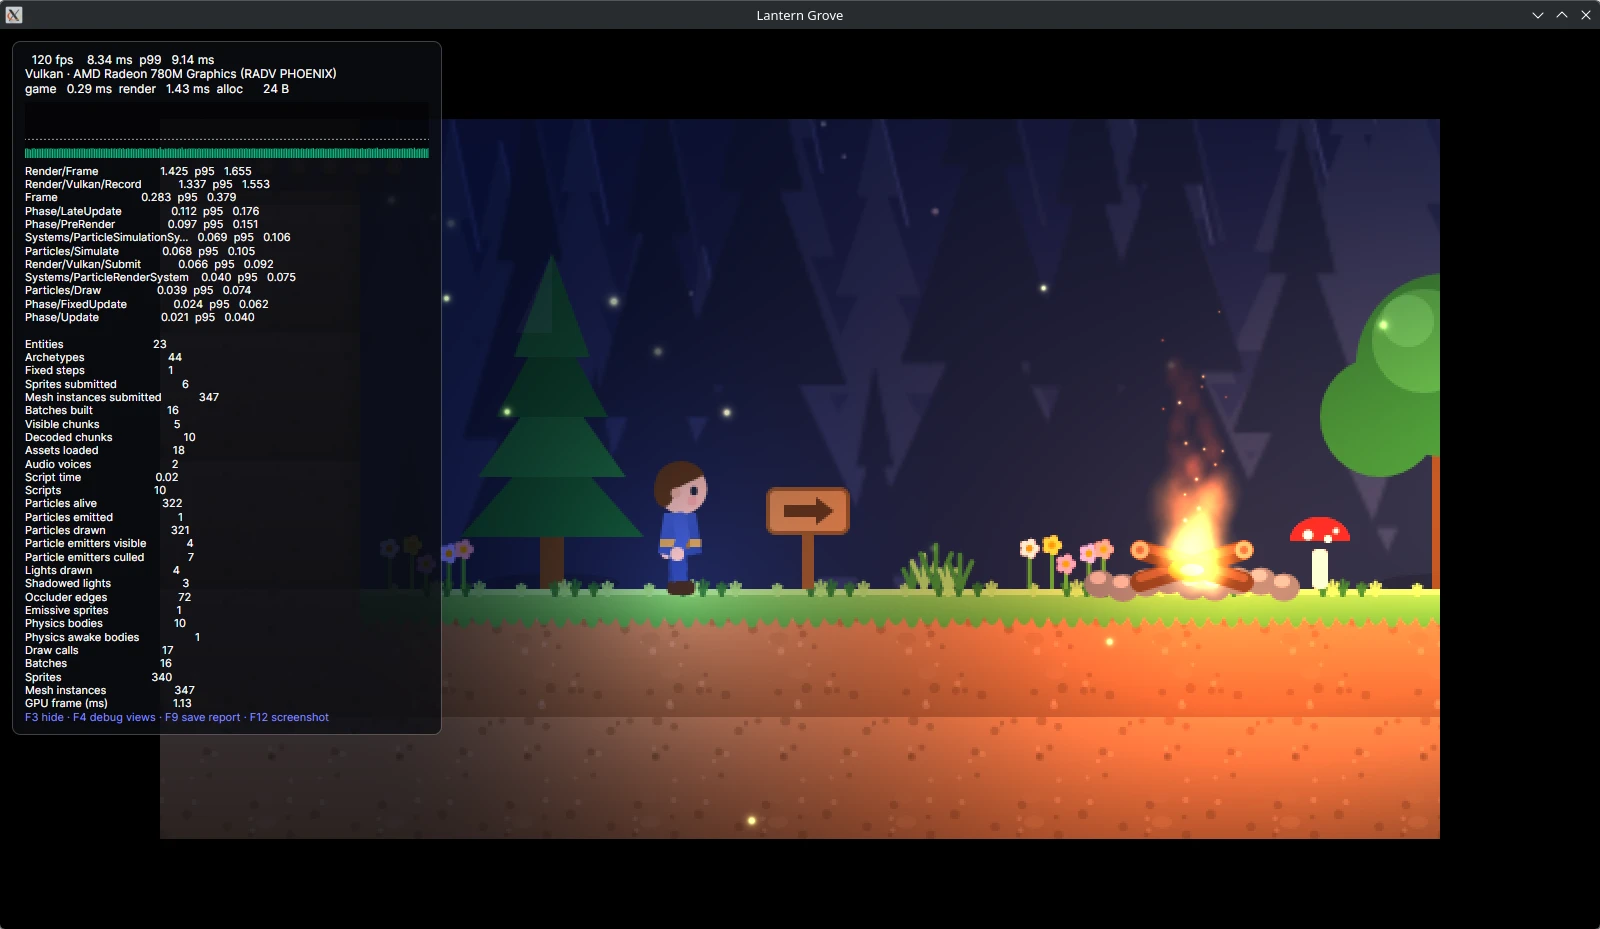
At 120 Hz a frame lasts 8.33 ms, so a 99th percentile near 9 ms means almost every frame arrived on its refresh. Lantern Grove, the most effect-heavy sample, draws its 640 × 360 view at 2× in this window, with black bars around it. With Vulkan it holds 120 fps on less than 2 ms of CPU time per frame; with Skia it misses some refreshes and averages 113 fps.
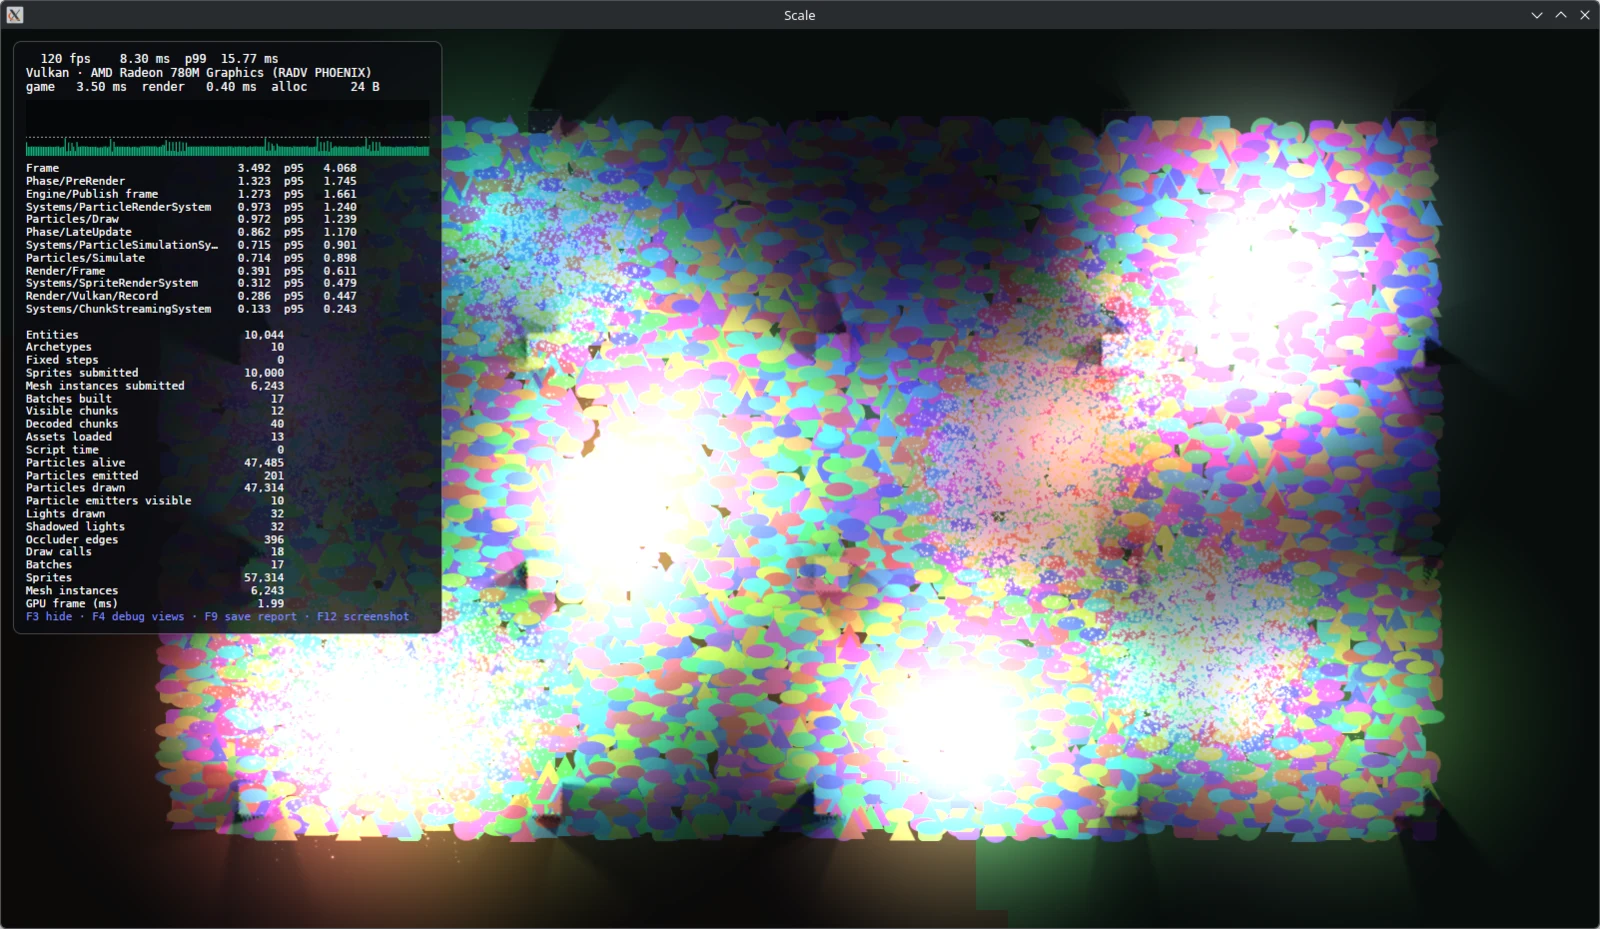
The scale scene puts everything on screen at once: 10,000 sprites, ten emitters holding about 47,500 particles, and 32 flickering lights that all cast shadows over a hex map of 2.1 million cells. With Vulkan it holds 120 fps, but its frame graph shows the occasional frame that misses a refresh and takes 16.7 ms; that is the 15 ms 99th percentile in the table. The game thread needs 3.5 ms per frame, most of it particles (about 1.6 ms simulating and drawing) and sorting the frame's draws (1.3 ms in Engine/Publish frame).
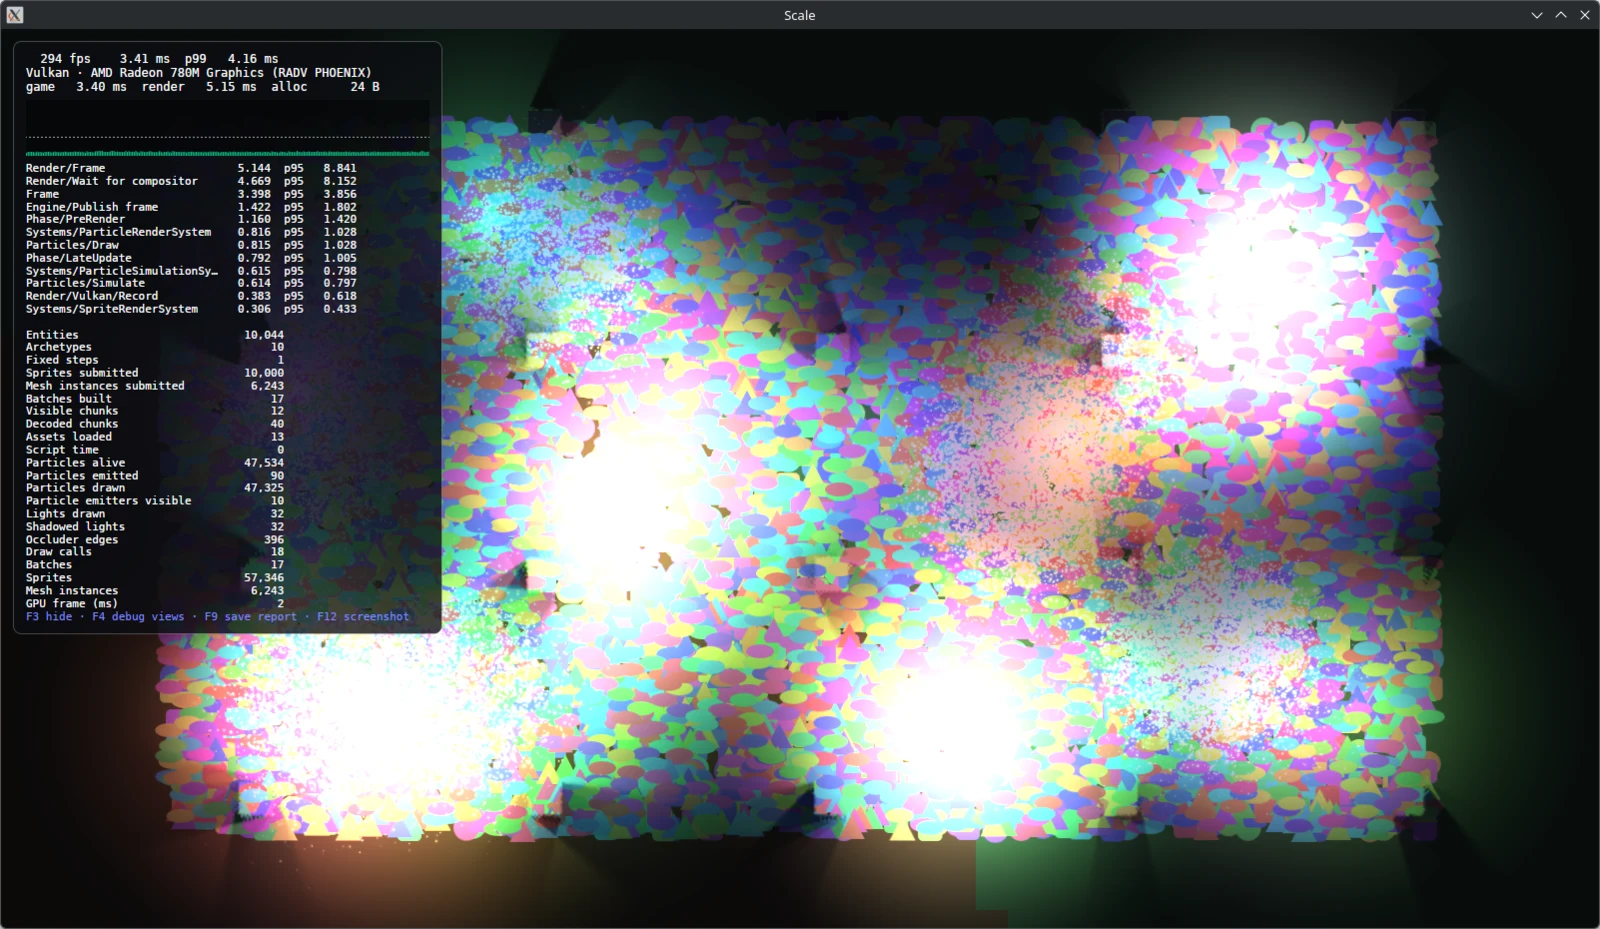
With VSync off the same scene runs at about 290 fps, limited by the game thread. The render thread's 5.2 ms is mostly Render/Wait for compositor: the window cannot show frames that fast, so the renderer waits and the newest frame wins.
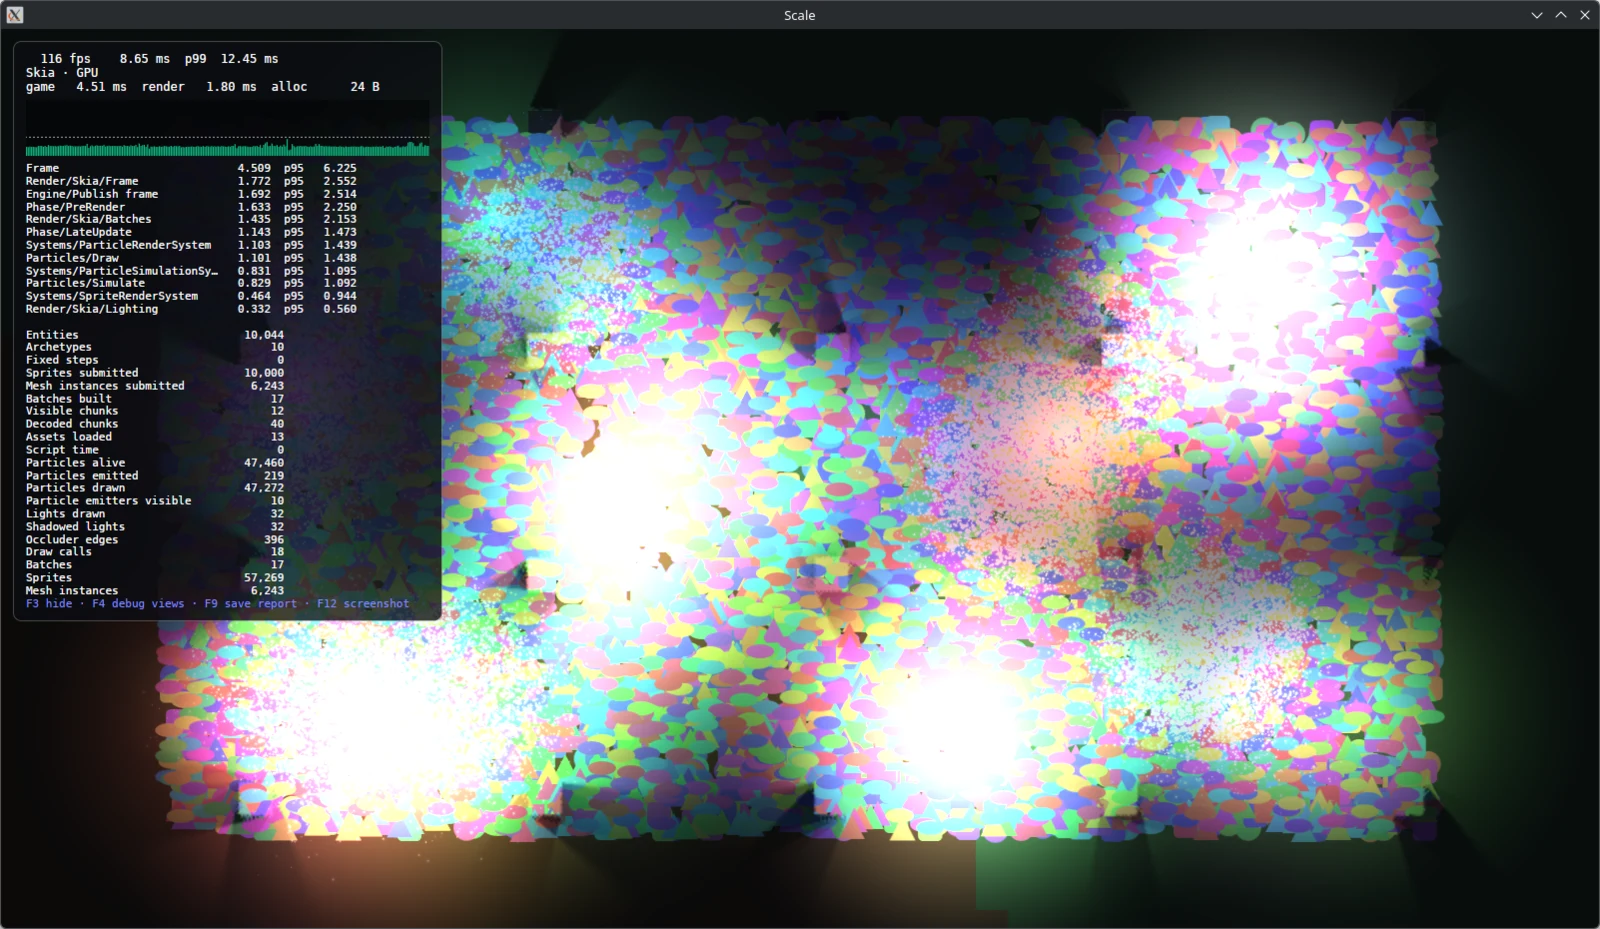
Skia in a window draws on the GPU through Avalonia's compositor. It runs Lantern Grove at about 113 fps, with 4.1 ms of render work, and the scale scene at about 114 fps, with 1.9 ms of render work and 4.8 ms of game work, against 3.5 ms with Vulkan.
The flyover follows a body across the map at 670 units per second, so chunks are decoded and meshed as they come into view. It stays at 120 fps with a 99th percentile of 9.5 ms. Frames where many chunks arrive at once cost up to about 3 ms of game work, still far below the frame budget.
Headless
The player's benchmark mode runs a game without a window at its window size from game.json, or the size you pass, and lays out its view as a window of that size would. It measures each frame's game work and render work back to back on one thread, so the frame rates are what the game and renderer could reach together if nothing else limited them. Isle Hopper and Lantern Grove run at 1280 × 720, where their 640 × 360 view is drawn at 2×, and Hex Quest at 1280 × 800. Averages, with the 95th percentile in parentheses, over the last 600 of 1,200 frames (600 for the scale scenes):
| Scene | Renderer | Game work | Render work (CPU) | GPU | Frame rate |
|---|---|---|---|---|---|
| Hex Quest | Vulkan | 0.07 ms (0.08) | 0.12 ms (0.15) | 0.18 ms | 5,284 fps |
| Isle Hopper | Vulkan | 0.08 ms (0.13) | 0.09 ms (0.11) | 0.16 ms | 5,715 fps |
| Lantern Grove | Vulkan | 0.05 ms (0.08) | 1.12 ms (1.25) | 0.77 ms | 861 fps |
| Lantern Grove, 1920 × 1080 | Vulkan | 0.16 ms (0.25) | 2.66 ms (2.87) | 1.91 ms | 355 fps |
| scale | Vulkan | 3.49 ms (4.30) | 0.35 ms (0.43) | 1.83 ms | 260 fps |
| scale, 1920 × 1080 | Vulkan | 3.52 ms (4.32) | 0.37 ms (0.48) | 2.23 ms | 257 fps |
| scale | none (--no-render) | 2.99 ms (3.24) | 334 fps | ||
| scale-flyover | Vulkan | 1.46 ms (4.38) | 0.24 ms (0.47) | 0.55 ms | 587 fps |
| Hex Quest | Skia, CPU | 0.05 ms (0.07) | 14.2 ms (14.7) | 71 fps | |
| Isle Hopper | Skia, CPU | 0.05 ms (0.09) | 7.5 ms (8.2) | 132 fps | |
| Lantern Grove | Skia, CPU | 0.14 ms (0.16) | 128 ms (132) | 8 fps | |
| scale | Skia, CPU | 3.04 ms (3.99) | 381 ms (523) | 2.6 fps | |
| scale-flyover | Skia, CPU | 1.63 ms (3.04) | 131 ms (326) | 8 fps |
Headless Skia renders on the CPU, unlike Skia in a window. Those rows show what happens on a machine where Skia has no GPU: simple scenes are fine, but lighting and tens of thousands of sprites are not. Lantern Grove, with four lights in view, takes 128 ms per frame where Isle Hopper takes 7.5 ms.
The game thread allocates nothing per frame in steady state: every run above reports between 24 and about 1,100 bytes per frame on average (Isle Hopper's crab system allocates a little), and no garbage collections. The flyover is the exception: the frames where sprites and emitters first come into view grow buffers, which costs a few megabytes and one collection of each generation over the run.
Physics and particles in isolation
BenchmarkDotNet results from benchmarks/Talesmith.Benchmarks with --job short, so expect the error margins of a short run (around 10 to 20 percent):
| Benchmark | 10,000 particles | 100,000 particles |
|---|---|---|
| Simulate one step, gravity and drag | 0.015 ms | 0.17 ms |
| Simulate one step, every module (noise, velocity, rotation, color and size curves) | 0.23 ms | 2.2 ms |
| Write the sprite instances to draw | 0.11 to 0.13 ms | 1.1 to 1.3 ms |
| Physics step (one fixed step, no sleeping) | 1,000 bodies | 4,000 bodies |
|---|---|---|
Pile: boxes and circles stacked in a container | 1.3 ms | 5.6 to 6.7 ms |
Swarm: bodies bouncing without gravity | 0.5 ms | 1.7 to 1.9 ms |
Tiles: bodies resting on a tile map | 1.2 ms | 6.7 to 7.0 ms |
None of them allocate. The two numbers for 4,000 bodies are the spatial hash and the dynamic tree broadphase. Physics runs once per fixed step, 60 times per second, so a pile of 1,000 bodies costs about 1.3 ms of every 60 Hz frame.
The editor
The editor runs the scene you edit in a live game on its UI thread, so its responsiveness depends on the size of the scene. These numbers come from a stress project of a hex map with 2 million cells and 5,000 entities (sprites, lights and particle emitters in groups of 100), opened in the real editor in a window with the Vulkan viewport. Each interaction ran continuously for five seconds while every frame interval was recorded:
| Interaction | 1600 × 1000 window | Maximized, 5120 × 1366 |
|---|---|---|
| Pan at 100% zoom | 7.8 ms median, 8.5 ms p95 | 8.0 ms median, 10.7 to 16.3 ms p95 |
| Pan at 25% zoom | 7.8 ms, 8.4 ms | 8.0 ms, 9.1 to 9.9 ms |
| Pan at 5% zoom (most of the map in view) | 7.8 ms, 8.5 ms | 8.0 ms, 15.0 to 16.1 ms |
| Zoom in and out continuously | 7.9 ms, 8.5 ms | 9.8 to 11.3 ms, 14.5 to 18.7 ms |
| Select a different entity every 6 frames | worst frame 56 ms | worst frame 84 to 89 ms |
| GPU time per viewport frame while panning | 0.1 to 0.2 ms | 0.6 to 0.9 ms |
The maximized column shows the range of two runs. At 1600 × 1000 the viewport keeps up with the 120 Hz display while panning and zooming, and maximized, at five times the pixels, the median interval stays at the 8 ms refresh with 5 to 12 percent of frames late. Selecting an entity of a kind the inspector has not shown yet builds an inspector page, which costs one long frame; selecting another entity of the same kind reuses the page. Opening the project until the scene showed took 2.8 seconds.
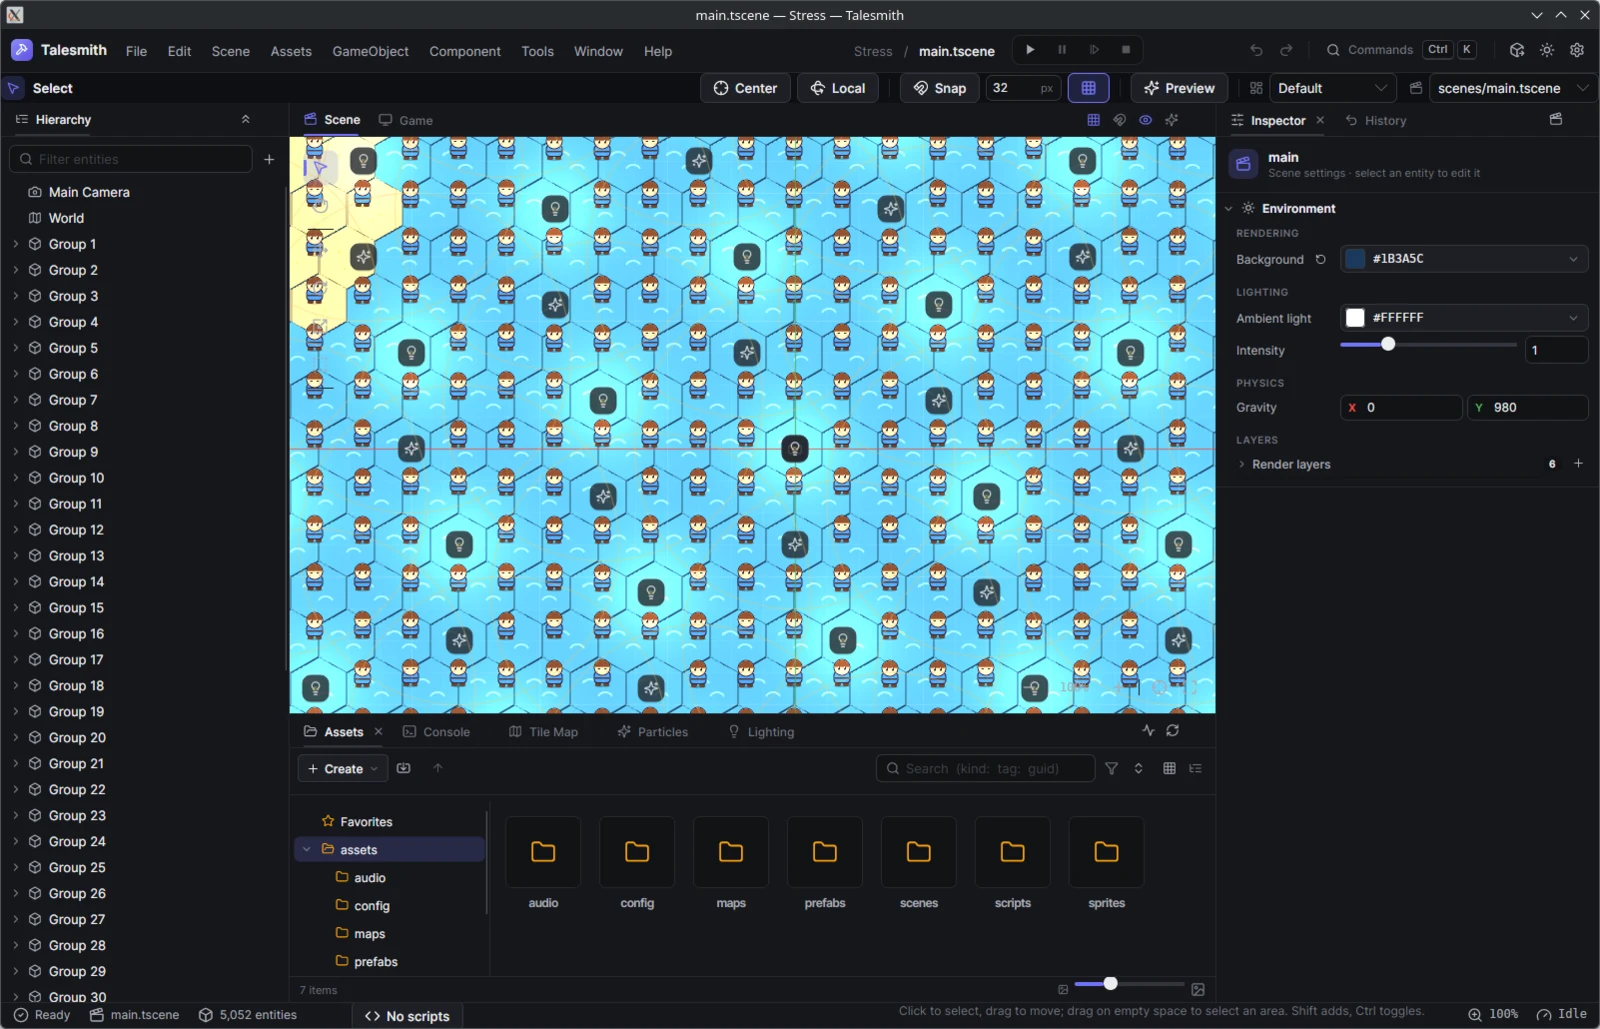
The repository's editor stress benchmark measures the same project headlessly and reports how long each interaction keeps the UI thread busy, which is what to compare when you work on the editor itself.
What is measured
Every frame is measured, all the time, by two profilers: Game for the game loop and Render for the thread that renders. The overlay, reports, headless benchmarks and live metrics all read the same data, so a number means the same thing everywhere.
| Measurement | Meaning |
|---|---|
| Frame interval | Time since the previous frame. This is what players feel; at 60 Hz it should sit at 16.7 ms, at 120 Hz at 8.3 ms. |
| Frame work | Time spent inside the frame. Game work is the game loop on the game thread; render work is the render thread's CPU time. |
| GPU frame | Time the GPU spent on the frame, measured with GPU timestamps. Vulkan only. |
| Allocated bytes | Managed memory allocated during the frame, and garbage collections by generation. |
| Markers | Time and allocated bytes per section: each step of the frame, every system (Systems/<Name>), every script type (Scripts/<Name>) and each part of rendering. |
| Counters | Values such as entities, sprites and mesh instances submitted, batches, draw calls, visible and decoded chunks, particles, lights and audio voices. |
The last 600 frames are kept. Statistics report the average, minimum, maximum and the 50th, 95th and 99th percentiles, so spikes are as visible as averages. A marker costs two timestamp reads and nothing in the profiler allocates per frame, so measuring stays on in every build.
Game work and render work run on different threads at the same time. A game is limited by whichever is slower, and by the display: with VSync on, the frame rate cannot exceed the refresh rate however little work a frame takes.
What costs time
| Content | What it costs | Seen in |
|---|---|---|
| Sprites | Building and sorting them each frame on the game thread: about 0.3 ms for 10,000 sprites in Systems/SpriteRenderSystem, plus sorting in Engine/Publish frame (1.3 ms when 10,000 sprites on four layers interleave by Y order). Sprites that share a texture and material draw in one batch. | Sprites submitted, Batches, Draw calls |
| Particles | Simulation scales with live particles and enabled modules (see the table above); drawing costs about as much again. 47,500 particles cost about 1.6 ms of game work. Emitters outside the view are culled and stop costing anything. | Particles alive, Particle emitters culled |
| Lights | Mostly GPU: each shadowed light renders a shadow map. The scale scene, with 32 shadowed lights and a half-resolution light map, takes 1.8 ms of GPU time on the 780M at 720p. On the CPU (headless Skia) lighting is very slow. | Lights drawn, Shadowed lights, GPU frame |
| Tile maps | Visible chunks are meshed once and drawn as cached meshes, so a static map costs almost nothing per frame whatever its size. Moving into new areas decodes chunks on background threads and meshes them as they arrive. | Visible chunks, Decoded chunks, Mesh instances |
| Map size | Memory, not frame time: chunks far from the camera are kept compressed. A 2.1 million cell map streams at 120 fps. | Decoded chunks |
| Resolution | GPU time grows with pixels: Lantern Grove takes 0.8 ms of GPU time at 1280 × 720 and 1.9 ms at 1920 × 1080, where its view is drawn at 3×. The view shows the same world area at every size, so the same sprites, particles and lights are drawn. | GPU frame |
| Zoom | Zooming out shows more chunks, sprites and lights at once. Particle emitters whose particles appear smaller than 2 pixels emit fewer particles. | Visible chunks, Particles emitted |
| Physics | Bodies in contact cost the most; see the physics table. | Physics bodies, Physics awake bodies, Physics/* markers |
| Scripts | Each script type is its own marker. Lantern Grove's ten scripts take about 0.02 ms per frame together. | Script time, Scripts/<Name> |
Measure your own game
The performance overlay
Press F3 while a game runs, in the player or in the editor's Game panel, to show the overlay. It refreshes four times a second and summarizes the last 120 frames. Set "showPerformanceOverlay": true in game.json to start with it visible.
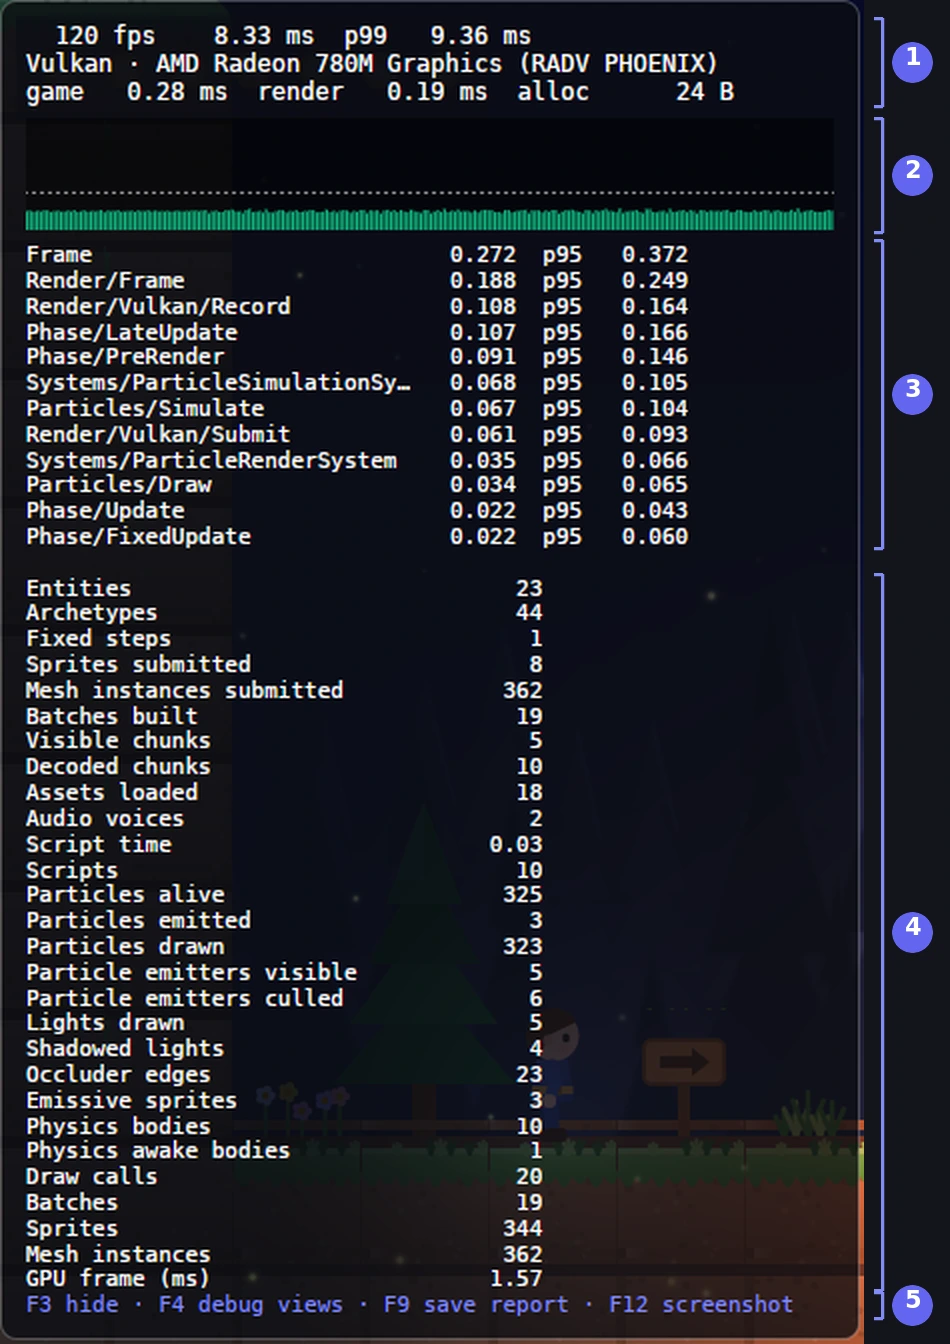
| Part | What to read | |
|---|---|---|
| 1 | Summary | Frames per second, the average frame interval and its 99th percentile; the renderer and GPU; the average game work, render work and bytes allocated per frame on the game thread. |
| 2 | Frame graph | Each frame's interval against a dashed 60 fps line: green within budget, amber up to twice the budget, red beyond. Spikes here are stutter players notice. |
| 3 | Slowest markers | The twelve most expensive markers of both profilers, average and 95th percentile in milliseconds. Start here when a frame is slow. |
| 4 | Counters | Every counter's latest value: entities, sprites, batches, draw calls, chunks, particles, lights, physics bodies and the GPU frame time. |
| 5 | Key hints | F3 hides the overlay, F4 cycles debug views, F9 saves a report, F12 saves a screenshot. |
Reading it:
- Allocations above zero every frame point at a system or script that creates garbage; the reports show allocated bytes per marker, so you can find which.
- High game work with low render work: look at the markers. Particles, sprites sorting (
Engine/Publish frame) and your own systems are the usual causes. - High GPU frame time: lights with shadows, high lighting quality, large resolutions or many large overlapping particles.
- Frame interval far above game and render work: the display limits the frame rate (VSync), or something outside the frame, such as the UI thread, is busy.
With VSync on, the frame rate is the display's refresh rate. To see how fast the game could run, set "vSync": false and "maxFramesPerSecond": 0 in game.json.
Debug views
F4 cycles through debug views: the grid cell under the pointer, then chunk outlines as well, then map objects and triggers as well, then off. Chunk outlines show what is visible and streaming, which helps when you tune a map's chunk size.
Profiler reports
F9 saves the last 600 frames of both profilers as a JSON file and a CSV file in ./captures, or the folder passed to the player with --captures. Exported games save them in the user's local data folder under the game's title. The headless benchmark saves the same report.
A report holds the environment, statistics for each profiler and every frame:
{
  "environment": {
    "device": "AMD Radeon 780M Graphics (RADV PHOENIX)",
    "renderer": "Vulkan",
    "resolution": "1280x720",
    "view": "fit 640x360 at 2x in 1280x720",
    "runtime": ".NET 10.0.12",
    "scene": "scene(path=scenes/grove.tscene)",
    "frames": "1200"
  },
  "profilers": [
    {
      "profiler": "Game",
      "frames": 599,
      "averageFramesPerSecond": 852.97,
      "frameInterval": { "average": 1.172, "p50": 1.152, "p95": 1.323, "p99": 1.416, "maximum": 1.543 },
      "frameWork": { "average": 0.051, "p50": 0.048, "p95": 0.077, "p99": 0.116, "maximum": 0.168 },
      "collections": { "gen0": 0, "gen1": 0, "gen2": 0 }
    }
  ]
}
The real file also lists every marker and counter with the same statistics. The CSV has one row per frame and one column per marker and counter, ready for a spreadsheet or a plotting tool. Compare reports only when they were made with the same resolution, renderer and scene.
Headless benchmarks
The player runs a game without a window for a fixed number of frames:
dotnet run -c Release --project src/Talesmith.Player -- samples/LanternGrove --benchmark --frames 1200 --renderer vulkan
It waits for the start scene, runs warm-up frames so caches fill and the JIT settles, measures, prints a table of every marker and counter and saves the report. Every frame advances the game by exactly 1/60 of a second, so runs are reproducible and two reports can be compared frame by frame.
| Option | Default | |
|---|---|---|
--frames <n> | 600 | Frames to measure. Reports keep the last 600. |
--warmup <n> | 60 | Frames before measuring. |
--size <w>x<h> | The window size in game.json | Resolution. The game's view is laid out for it as for a window of that size. |
--renderer <auto|vulkan|skia> | from game.json | Backend. Headless Skia renders on the CPU. |
--no-render | Measures the game loop only. | |
--report <path> | captures/benchmark-<time>.json | .json or .csv. |
To measure everything under load, generate the scale scenes:
dotnet run -c Release --project benchmarks/Talesmith.Benchmarks -- scale-scene artifacts/scale
dotnet run -c Release --project src/Talesmith.Player -- artifacts/scale/scale --benchmark --frames 600 --renderer vulkan
dotnet run -c Release --project src/Talesmith.Player -- artifacts/scale/scale-flyover --benchmark --frames 600 --renderer vulkan
Both are ordinary game folders, so you can also play them in a window: dotnet run -c Release --project src/Talesmith.Player -- artifacts/scale/scale.
Live metrics
Running games publish their profilers through System.Diagnostics.Metrics under the meter Talesmith, averaged over the last 60 frames. Watch them with dotnet-counters:
dotnet tool install --global dotnet-counters
dotnet-counters monitor --name talesmith-player --counters Talesmith
dotnet-counters collect --process-id <pid> --counters Talesmith --format csv -o metrics.csv --duration 00:00:15
| Instrument | Unit |
|---|---|
talesmith.fps | frames per second |
talesmith.frame.interval, talesmith.frame.interval.p99 | ms |
talesmith.frame.work | ms |
talesmith.frame.allocated | bytes per frame |
talesmith.marker.duration | ms per frame, tagged by marker |
talesmith.counter | per frame, tagged by counter |
Each measurement is tagged with its profiler, Game or Render. The window measurements on this page were collected this way, for example:
talesmith.fps ({frame}/s)[profiler=Game]                    119.96
talesmith.frame.interval (ms)[profiler=Game]                8.33
talesmith.frame.interval.p99 (ms)[profiler=Game]            9.36
talesmith.frame.work (ms)[profiler=Game]                    0.30
talesmith.counter[counter=GPU frame (ms);profiler=Render]   1.60
Any OpenTelemetry exporter can collect the same instruments.
Measuring your own code
Systems and scripts are measured automatically. To measure a section inside a system, declare a marker once and measure with it:
public sealed class PathfindingSystem(EngineProfilers profilers) : ISystem
{
    private static readonly ProfilerMarker FindPath = ProfilerMarker.Get("Gameplay/Find path", "Gameplay");
    private static readonly ProfilerCounter PathsFound = ProfilerCounter.Get("Paths found", CounterKind.PerFrame, "paths");

    public void Update(in SystemContext context)
    {
        using (profilers.Game.Measure(FindPath))
        {
            // …
        }

        profilers.Game.Increment(PathsFound);
    }
}
New markers and counters appear in the overlay, reports and live metrics without further setup.
Choosing a renderer
| Renderer | Use it when | Watch out for |
|---|---|---|
| Vulkan | A Vulkan device is available, which is the default with "renderer": "auto". Lowest CPU cost, GPU timing in the overlay, and frames reach the window as shared GPU images. | The log says how frames reach the window. When the compositor cannot import Vulkan images, the host switches to Skia on the window's GPU. |
| Skia on the GPU | Machines without Vulkan, or compositors that cannot share images. Close to Vulkan for typical scenes: Lantern Grove runs at 113 fps in a 1600 × 900 window, against 120 fps with Vulkan. | More game-thread work in very large scenes, and no GPU timing. |
| Skia on the CPU | Only when there is no GPU at all, such as headless runs, remote desktops or software compositing. | Lighting and large sprite counts are very slow: Lantern Grove renders at 8 fps, the scale scene at under 3 fps. Keep scenes small and lights few. |
"renderer": "auto" in game.json picks Vulkan when it can and falls back to Skia. The player's log states the choice and the reason, such as "Rendering with Vulkan on AMD Radeon 780M Graphics (RADV PHOENIX); frames go to the window as shared GPU images".
Budgets and tips
For a 60 Hz game you have 16.7 ms per frame; for 120 Hz, 8.3 ms. The game thread and the render thread each get that much, in parallel. On the test machine the scale scene uses 3.5 ms of game work and 2 ms of GPU time, so it fits a 120 Hz budget with room to spare; use it as a rough ceiling for one scene on similar hardware.
-
Particles. Keep
maxParticlesper emitter close to what the effect needs; the scene-wide cap is 200,000, and above 80% of it every emitter emits progressively less. Each enabled module adds simulation cost, noise and curves the most. A graphics menu can lowerParticleOptions.EmissionScalefor all emitters at once. See Particles. -
Lights. Shadows cost GPU time per light. The lighting quality presets cap what is drawn per frame:
Quality Light map resolution Lights Shadowed lights Shadow resolution Shadow samples Shadow casters Low 25% 16 4 256 1 64 Medium (default) 50% 32 8 512 5 256 High 100% 64 16 1024 9 1024 The brightest and nearest lights win when there are more than the limit. Use Medium unless the shadows look too soft, and offer Low in a graphics menu for weak GPUs. See Lighting.
-
Sprites and batching. Sprites that share a texture and material draw in one batch. Put small sprites that appear together in one sprite atlas, and use few render layers where you can; interleaving many layers and Y-sorted sprites makes sorting more expensive.
-
Tile maps. Static map content is cheap at any size. Keep collision layers simple, since they also cast shadows and build physics shapes per chunk. Use the default chunk size unless the chunk outlines (F4) show very few or very many chunks on screen.
-
Scripts. Aim for zero bytes allocated per frame. The script compiler warns about the usual causes in update methods:
TS1001blocking calls,TS1002allocations,TS1003string building, andTS1004forasync void. Cache what you look up, and reuse lists. See Scripting. -
Systems. Prefer
Query.Runwith struct jobs in hot systems;ForEachwith a lambda that captures variables allocates. Declare markers, counters, queries and materials once, in fields. Record structural changes in the command buffer instead of making them in loops. -
Compare like with like. When you compare two reports, use the same resolution, renderer, scene and frame count, and a Release build.
Known limits
- Headless Skia renders on the CPU and cannot keep up with lighting or tens of thousands of sprites. In a window Skia uses the GPU.
- Sorting interleaved, Y-sorted sprites is single-threaded: 10,000 of them cost about 1.3 ms of the game thread per frame.
- With VSync on, a scene that uses several milliseconds of game work still misses an occasional refresh at 120 Hz (the scale scene's 99th percentile is 15 ms), so very heavy scenes show rare single-frame hitches.
- Frames where many sprites and emitters come into view for the first time grow internal buffers, which allocates and can cause one garbage collection.
- The editor runs the edited scene on its UI thread. With very large scenes, a maximized window on a large display drops some frames while zooming, and the first selection of each kind of entity takes one long frame.
- GPU timing is only available with Vulkan.
Related
- Screenshots, smoke tests and benchmarks: the editor stress benchmark, micro-benchmarks and the scale scenes
- Runtime architecture: the frame, threads and what each marker covers
- Play mode